


If you have ever watched the Microsoft Excel World Championship, you will know it looks more like e-sports than spreadsheet work. Competitors fly through XLOOKUPs, dynamic arrays, Power Query and VBA under intense time pressure.
It is impressive. But for me, the real lesson is not speed. It is clarity.
Excel is not just a back-office tool. Used properly, it is a transparent thinking environment. And that makes it an ideal place to learn geostatistics from first principles.
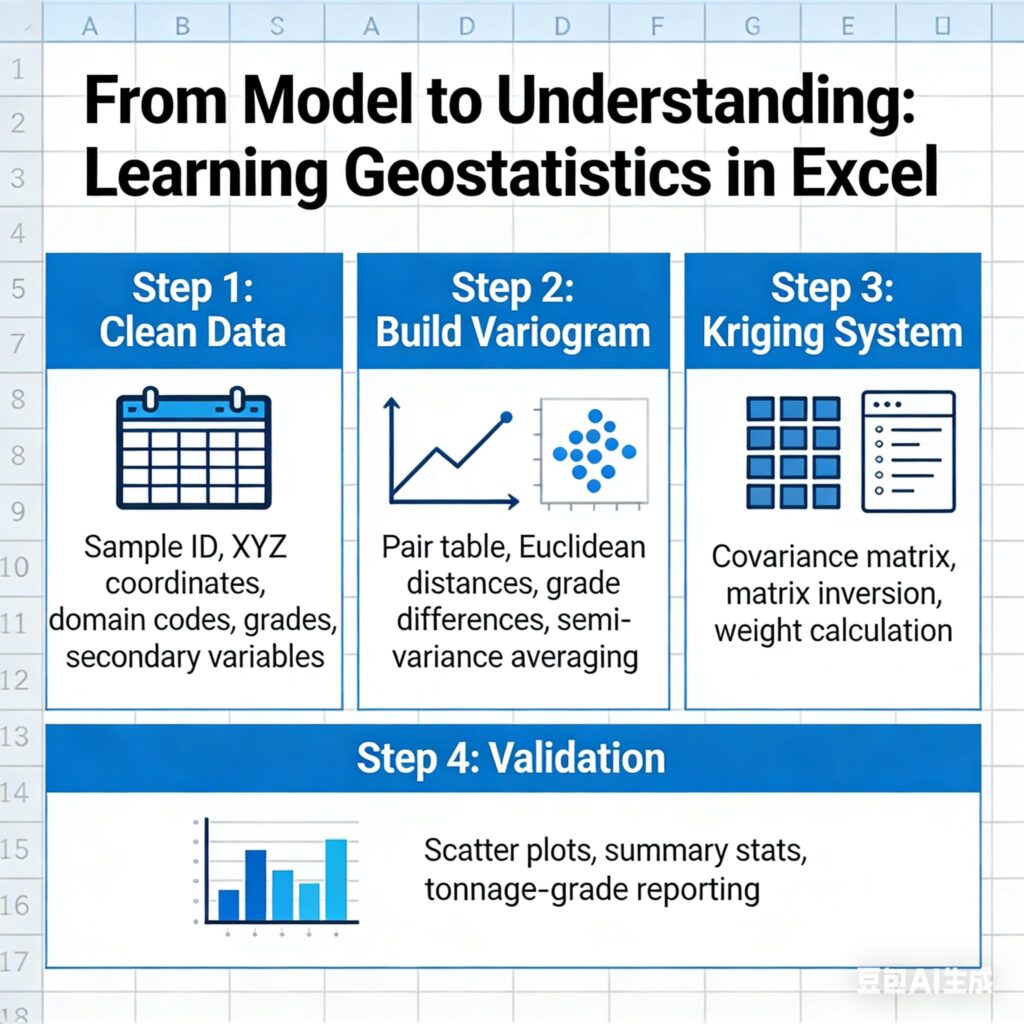
Geostatistics is not magic. It is a chain of small, logical decisions:
In commercial software, many of these steps sit behind dialogue boxes. In Excel, every number sits in a cell. You can point to it and trace exactly where it came from.
That transparency matters, especially when you are learning.
I am not suggesting we replace specialist software. But if you can build the workflow once in Excel on a small dataset, you gain the intuition that carries across any platform you use later.
Geostatistics does not rescue messy inputs. It magnifies them.
The first step is always a clean, explicit dataset:
From there, basic checks are essential. Missing values. Duplicate records. Coordinate inconsistencies. Domain mismatches. Simple histograms and summary statistics by domain. Trend plots to assess stationarity.
These are not glamorous tasks. But they build discipline. And discipline in data handling is foundational to credible resource estimation.
At the core of most estimation workflows sits the variogram. It measures spatial continuity.
In Excel, you can construct this step by step:
When you plot distance against semi-variance, the relationship becomes visible. And when you change the lag width, maximum distance or domain, you see immediately how those choices influence the shape of the variogram.
That sensitivity is powerful. Nothing is hidden.
Kriging is often perceived as complex because it involves matrices and systems of equations. But in Excel, with a small dataset, you can construct the covariance matrix between samples and between samples and the estimation point.
Invert the matrix. Multiply. Solve for weights.
Suddenly, kriging is no longer abstract. You can see:
This is where first-principles learning becomes valuable. Once you understand the mechanics, commercial software workflows become easier to trust and easier to critique.
Validation does not need to be complicated.
Simple scatter plots. Summary statistics comparisons. Whole-of-domain comparisons. Tonnage-grade reporting. These can all be structured in Excel.
Many operations still rely heavily on spreadsheets for reconciliation. While it may not always represent best practice at large scale, a well-designed and transparent system can remain robust if constructed thoughtfully.
The key is clarity.
Interestingly, the same approach applies to machine learning.
Linear regression is already part of many geologists’ daily workflows. More advanced methods such as random forests or neural networks can also be prototyped at small scale in Excel.
Excel will not run an industrial-scale simulation. But it is an excellent sandbox for understanding how algorithms work under the hood.
The Excel World Championship celebrates mastery under pressure. For resource geologists, the lesson is simpler.
Excel can be a structured, step-by-step environment for thinking.
If you can move from clean data to pair tables, experimental variograms, model fitting, kriging systems and validation in a transparent way, you are not just pushing buttons. You understand what each decision does.
And once you have built it yourself, every other software workflow becomes clearer.
That confidence is what ultimately separates model building from genuine resource estimation expertise.
WANT TO LEARN MORE?
Dr Gregory Zhang presents two Excel training courses that could be of interest to you:
Essential Excel Skills for Geologist, and Advanced Excel Skills for Kriging & Simulation
Link to courses: https://snowdenoptiro.com/professional-development/
To register on these courses, please email training@snowdenoptiro.com
Snowden Optiro is a resources consulting and advisory group that provides independent advice, consulting and training to mining and exploration companies, their advisors and investors.
We help mine developers to advance their projects, mining companies to improve their operations and their professionals, and investors to de-risk their investments by the provision of quality advice, training and software in the field of Mineral Resources and Mineral/Ore Reserves.